Plans and steps checked 2026-10-12. Claude Dashboards is in beta, so details may change.
Last week Anthropic launched Claude Dashboards: ask a question about your data and Claude builds a page of charts. (We covered what it is in our launch post.) This post is the hands-on part: getting your own tool’s data into a dashboard.
Here’s the catch. Right now there are only two ways to feed a Claude Dashboard: a data warehouse (one big, organized store of company data, like Snowflake or BigQuery) or a connector (an app you’ve linked to Claude). Anthropic hasn’t published a way to push data in from outside, like an API you could send numbers to.
Most of us don’t have a data warehouse. But lots of the tools we use every day now offer an MCP server. That makes MCP connectors the easiest door into Dashboards for almost everyone else.
The two words you need
- MCP (Model Context Protocol): a standard plug that lets an AI assistant read data from another app, and sometimes take actions in it. Think of it as a USB port for AI. Any tool with an MCP server can plug into Claude the same way.
- Connector: Claude’s name for an MCP server you’ve plugged in.
For our example we used an error tracker, a service that logs every crash in an app (BugSnag, through SmartBear’s MCP server). Don’t get hung up on that. The steps are the same for an issue tracker, a CRM (customer database), a project board, or anything else with an MCP server.
Do you have the right plan?
Checked 2026-10-12 against Anthropic’s help center.
| Dashboards | Custom connectors | |
|---|---|---|
| Free | No | Yes, but only one |
| Pro and Max | Yes (beta) | Yes |
| Team | Yes (beta) | Yes, after an owner adds it for the team |
| Enterprise | Yes (beta), after an owner turns it on | Yes, after an owner adds it |
In plain words: you need a paid plan for the dashboard part. On a Team or Enterprise plan, ask whoever runs your company’s Claude account to switch Dashboards on and add the connector. After that, each person signs in to the connector themselves, so Claude only sees what you can see in that tool.
Dashboards also count toward your plan’s usage limits, like any other chat. Anthropic hasn’t said how much one uses.
Step 1: find and add your connector in Claude Desktop
Claude Desktop has two kinds of plug-in, and for dashboards the difference matters:
- Connectors (remote). These live on the internet and you sign in to them, a bit like logging in to a website. Once added, they work everywhere you use Claude: desktop, web and phone. Use this kind for dashboards.
- Desktop extensions (local). These run on your own computer, under Settings > Extensions, and only work in Claude Desktop and Claude Code. A dashboard can use them while it’s being built, but can’t go back to them later for fresh data. More on that below.
If your tool is already listed: open the Connectors Directory, find it, and click to connect. Many popular tools are already there. Ours was listed as “SmartBear MCP”.
If it isn’t listed, add it as a custom connector (Pro or Max):
- Go to Customize > Connectors.
- Click + Add, then Add custom connector.
- Give it a name, and paste the MCP server’s web address from the tool’s own docs. Click Continue.
- Choose how to sign in. Most servers open a browser sign-in page. Some ask for an API key (a password-like code) instead.
- Click Add.
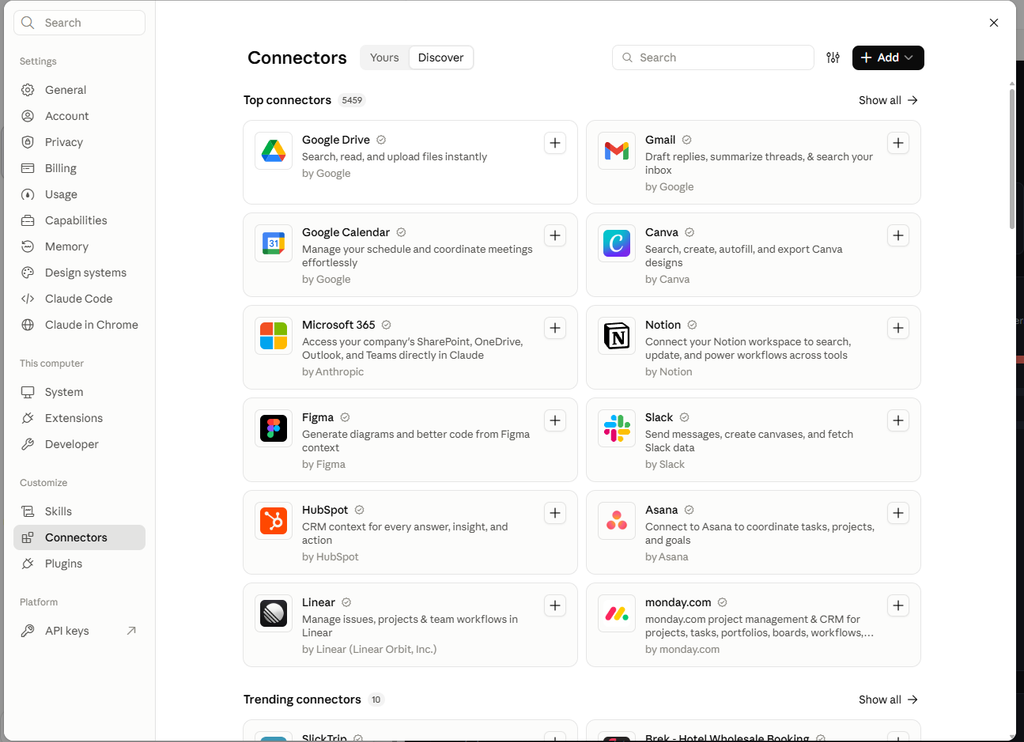
On Team or Enterprise, an owner adds the connector under Organization settings > Connectors. You then find it in your Connectors list (usually labeled “Custom”) and click Connect to sign in.
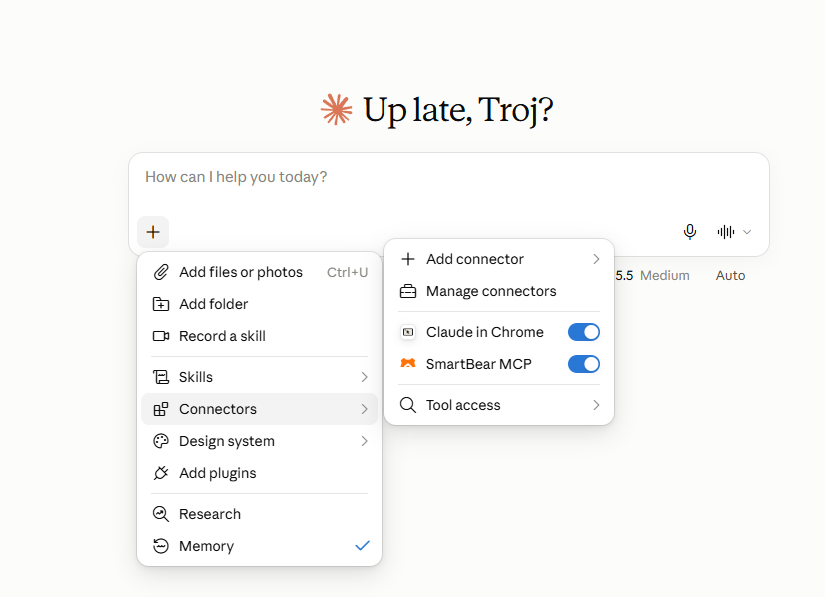
To use it in a chat: click the + at the bottom left of the message box, choose Connectors, and switch yours on for that conversation.
Step 2: restart Claude Desktop (the quirk)
This one cost us some head-scratching. Our connector worked in a normal chat straight away. But when we went to build a dashboard, Claude couldn’t see it. Fully quitting Claude Desktop and opening it again fixed it.
This isn’t in Anthropic’s docs. It’s just what happened to us, on Claude Desktop version [add version]. If your connector is missing when you build a dashboard, try a restart before anything else.
Step 3: start a dashboard
You have two ways in:
- From a chat: just ask for a dashboard (or pick Output > Dashboards in the message box).
- Directly: go to Artifacts > Dashboards and start one there.
Step 4: three prompts, one at a time
Send each prompt, then wait for Claude to finish before sending the next. Changing one thing per message means that if something breaks, you know which request caused it.
Here’s the pattern, with what we actually typed:
1. Build it.
Pattern: “Using the [name] connector, build a dashboard of [what you track] and [the measure you care about].”
Using the BugSnag connector, build a dashboard of our top errors
and our resolution metrics.
That prompt is vague on purpose, to see what Claude would pick. For “resolution metrics” it chose [fill in: e.g. errors fixed per week, average days to fix]. Next time we’d be more specific, with a time range and the exact measures:
Using the BugSnag connector, build a dashboard for the last 30 days:
the 10 errors affecting the most users, how many errors were marked
fixed each week, and the average number of days to fix one.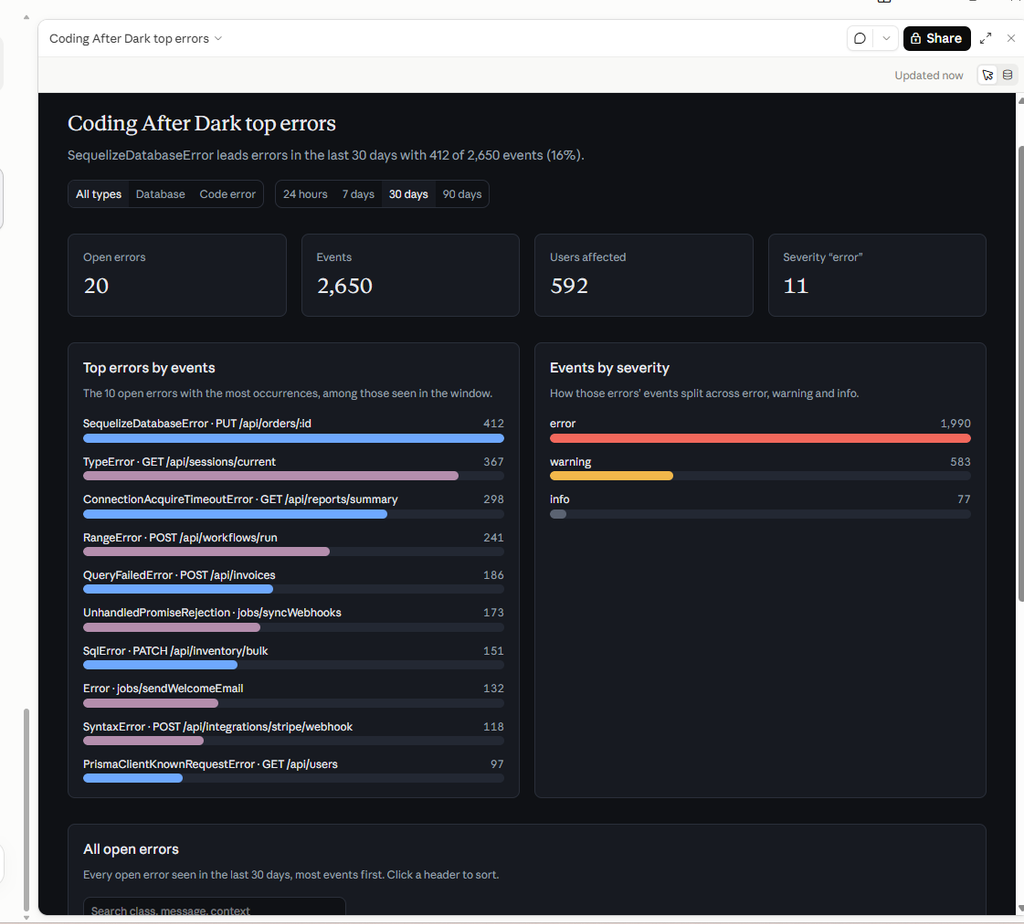
2. Restyle it.
Update the dashboard to use dark mode.3. Add a filter.
Pattern: “Add a filter that splits [items] into [group A] and [everything else].”
Add a filter that splits errors into database errors and
non-database errors.
This is the step worth a second look. Claude has to invent a rule for what counts as a “database error”: the error’s name, words in the message, something else? So we asked:
How did you decide which errors are database errors?If the rule looks wrong, tell Claude what to change. It’s the same habit we talked about in the launch post: every chart has a receipt, so read it.
Step 5: share it
Dashboards start private. To share one, open it and click Share.
Before you send the link, read the next section. Who sees what depends on how your dashboard gets its data.
Does it stay up to date?
The short version: a dashboard built on a remote MCP connector can refresh. One built from copied-in data is a snapshot.
Anthropic’s help article only says that each chart shows “when its data was last refreshed.” It doesn’t say how often, or how. The details below come from a hands-on review by the team at Tabular Editor, not from Anthropic.
When Claude builds a dashboard, it gets the data one of two ways:
- A live query. Claude saves the question it asked your tool, so it can ask again later and get today’s answer. Think of a saved search: open it next week and the results are new. This only works with a remote connector.
- An extract. Claude copies the data into a file inside the dashboard. Think of a photo of a whiteboard: it never changes. To update it, Claude has to rebuild the copy. Desktop extensions can only work this way.
How to tell which one you have:
- Look for a refresh button. In Tabular Editor’s tests, one appeared at the top only on dashboards with live queries. Clicking it asks your tool again, and hovering over it shows how fresh the data is.
- Check where the numbers come from. Click the database icon to open the sources view. A query means live data. A file name means a snapshot.
Nobody has published a refresh schedule. Until Anthropic says otherwise, think “updates when someone clicks refresh,” not “updates every hour on its own.”
What this means for sharing. According to the same review, live queries run as the person viewing, using their own sign-in to your tool. So a teammate without access to the tool may see nothing, and two people may see different numbers. With a snapshot, anyone who can open the dashboard can read the copied data.
What to watch out for
- Keep it read-only. Many MCP servers can change things, not just read them. Ours can mark errors as fixed, for example. In a chat, the Search and tools menu lets you switch off individual tools. Anthropic’s own connector guide recommends turning off tools that can make changes. And if Claude asks to take an action, read it before you approve it.
- Only connect servers you trust. Anthropic warns that custom connectors can link Claude to services it hasn’t checked. Stick to MCP servers from the tool’s own maker, and review what permissions it asks for when you sign in.
- Blur before you share. Data from work tools often includes names, emails, IDs and internal links. Blur them in screenshots, and think about who gets the dashboard link.
- Check one number you already know. Before trusting a new dashboard, find a figure you’re sure of (last week’s error count, say) and make sure it matches.
- It’s a beta. Expect rough edges, like our restart quirk.
After After Dark To Try
- Connect one tool you already use that has an MCP server, and ask for a dashboard with a single chart. Start small.
- Open the sources view on your dashboard and work out whether it’s live or a snapshot. If it’s live, click refresh tomorrow and see what changes.
- Ask Claude to explain one filter. Pick any filter or grouping it made and ask how it decided. You’ll learn how much to trust it.
Sources
All opened 2026-10-12.
Official (primary sources)
- Claude help center: Get started with Claude Dashboards: plans, the Enterprise switch, data sources (warehouses and connected apps), Artifacts tab and Output > Dashboards, “last refreshed” times, private until shared, usage limits.
- Claude help center: Get started with custom connectors using remote MCP: plans and the Free limit of one, steps to add a custom connector, the Team and Enterprise owner steps, + > Connectors, Search and tools, the security warning and advice to turn off write tools.
- Claude help center: When to use desktop and web connectors: remote connectors vs desktop extensions, Settings > Extensions, the Connectors Directory.
- SmartBear MCP on GitHub: our example server, its hosted web address and browser sign-in.
- SmartBear blog: BugSnag and SmartBear MCP (August 21, 2025): shows the server can change data (“Mark this error as fixed”).
Secondhand, hands-on
- Tabular Editor: What are Claude Dashboards? (Ruben Van de Voorde and Kurt Buhler, October 12, 2026): live queries vs extracts, the refresh button, the sources view, queries running as the viewer, local MCP servers only feeding extracts.
Our own testing
- The prompts, the restart quirk and the screenshots are from our own build in Claude Desktop, October 2026.